Makerspace Community Building
Description
I worked with the Seattle Makers makerspace to better understand their community and how to strengthen it. I ran a survey with the member-base and analyzed the results to understand 1) how strong is the sense of community currently and 2) what factors impact members' sense of community? I then analyzed the results for statistically significant correlations. This work informed the Seattle Makers strategy going forward.
Project type
Quantiative Analysis, Survey Design
Role
Lead UX Researcher
Date
February - March 2023
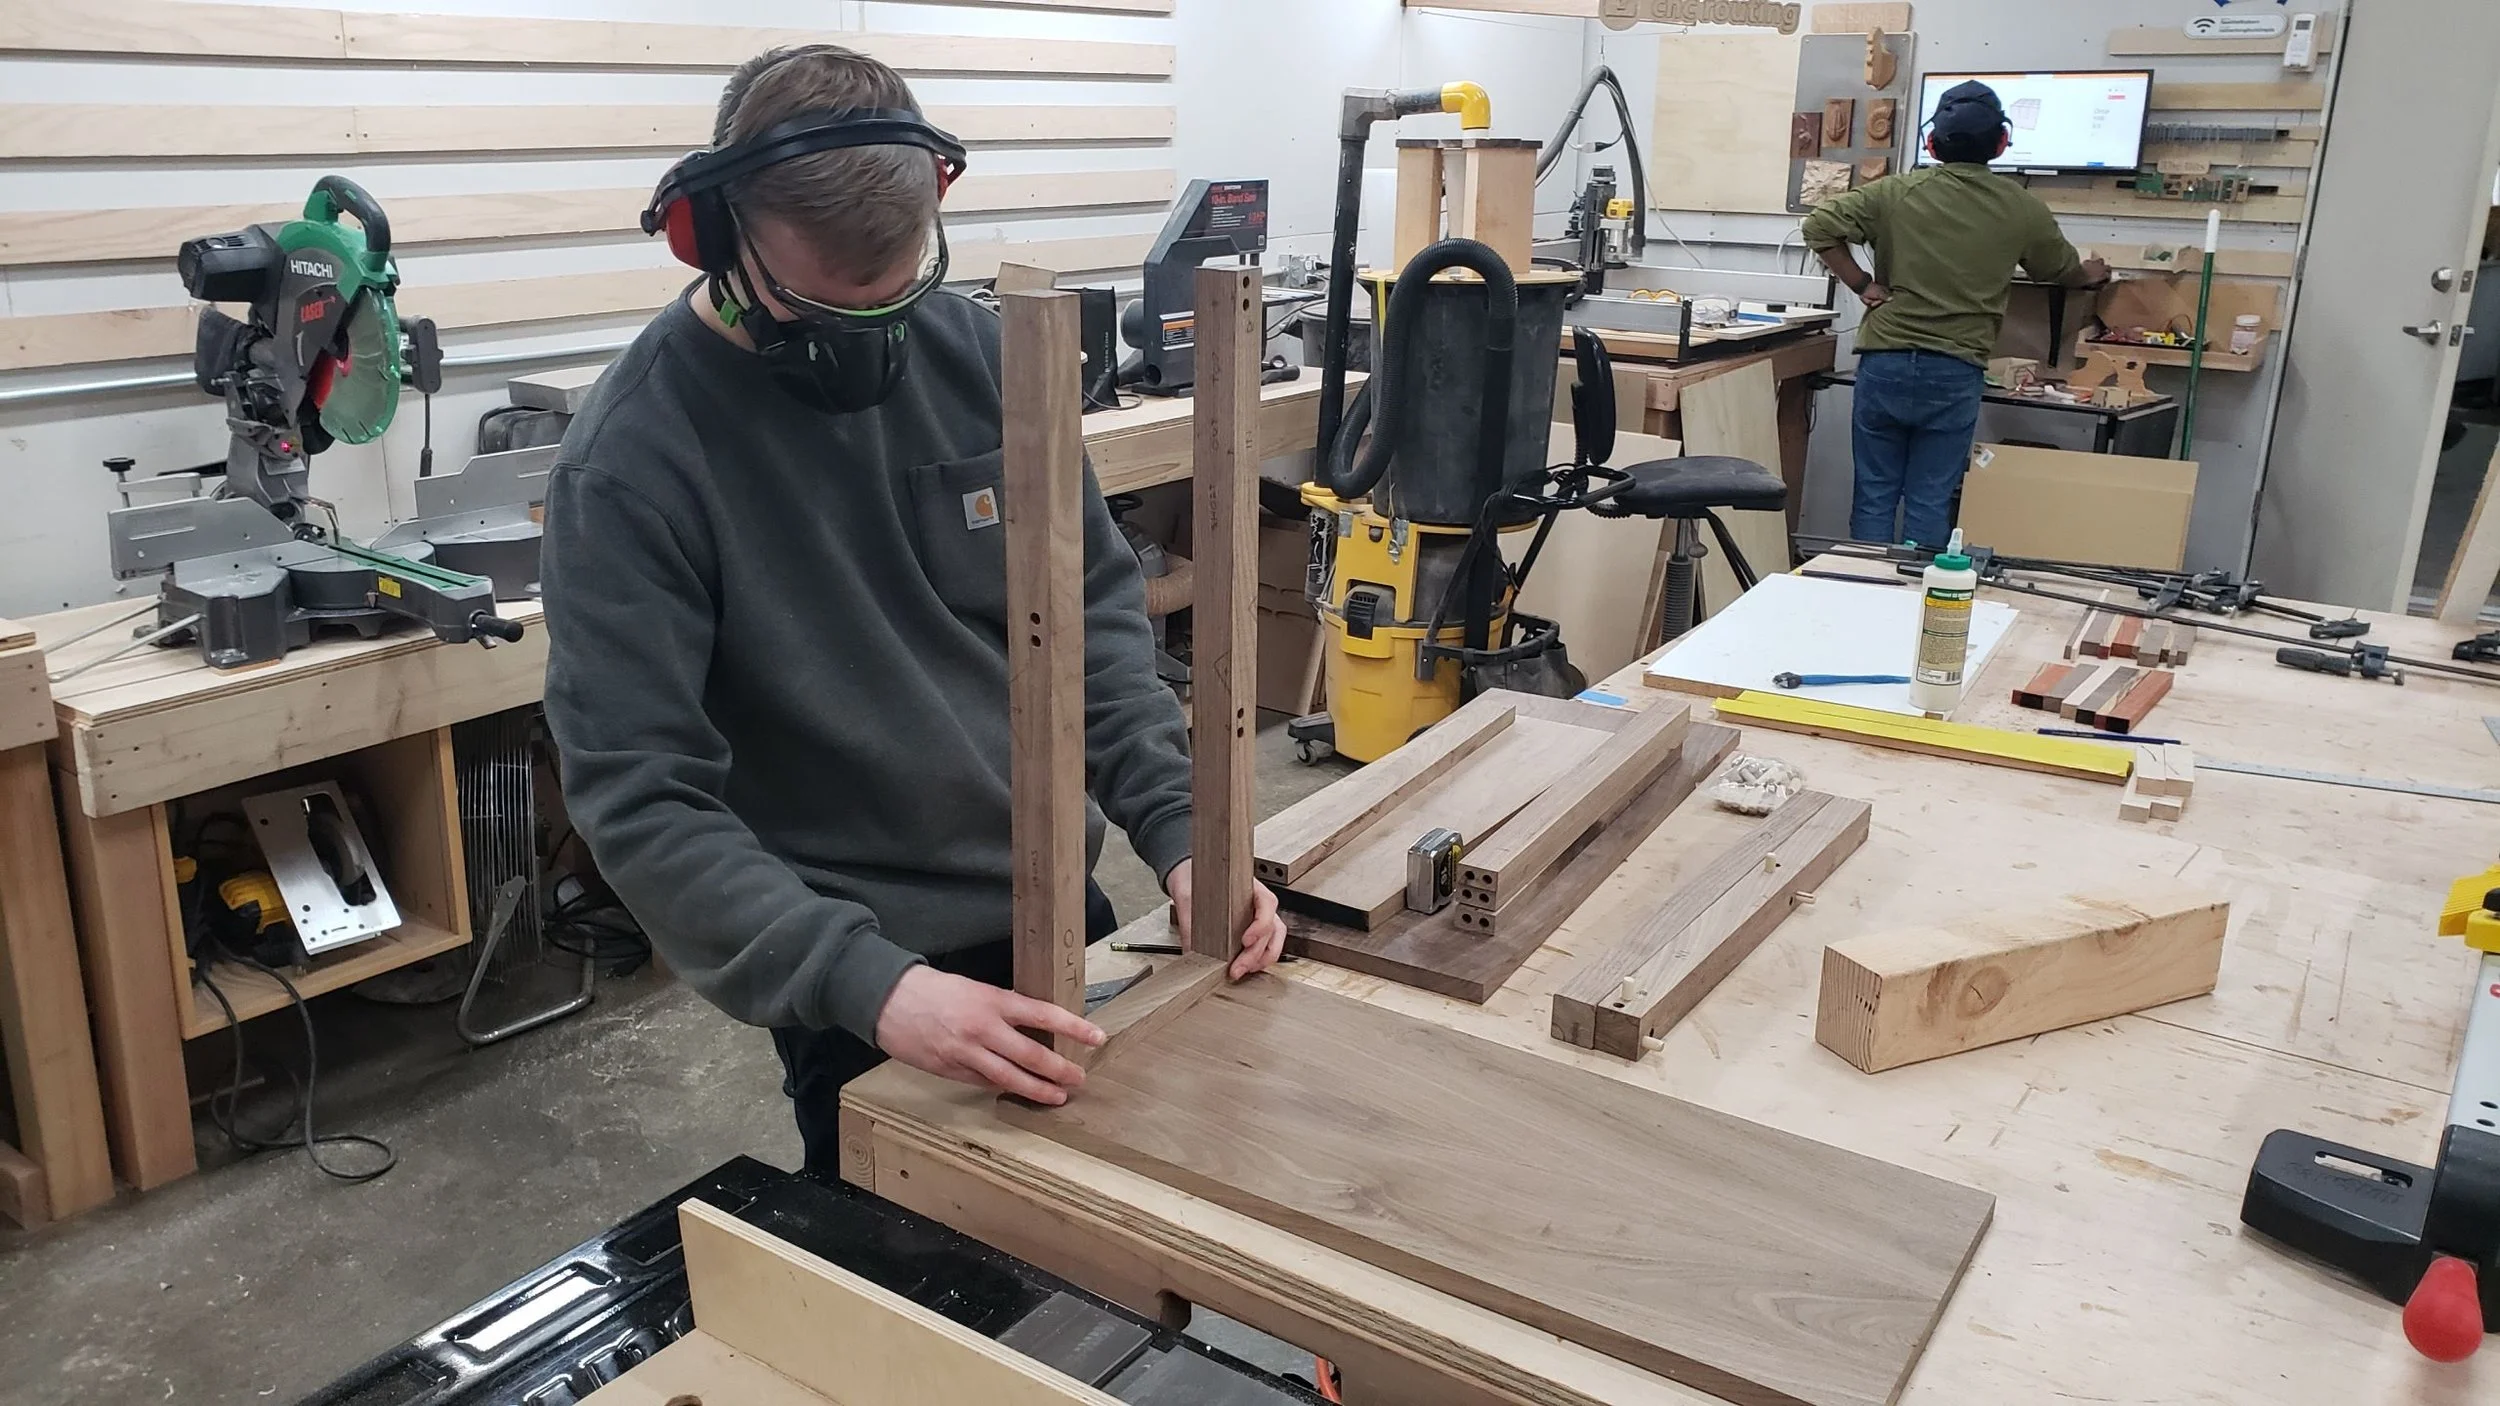
The Problem
Seattle Makers is a makerspace, a public space for making things stocked with tools like 3D printers and laser cutters. Their membership had recently grown significantly and now they were focusing on building the sense of community among members. But they didn’t know what programs or process changes to invest in to make a difference. I created a survey that focused on what the sense of community was now and what factors can help strengthen it. The results of my analysis gave the makerspace direction for where to invest their time in order to build community.
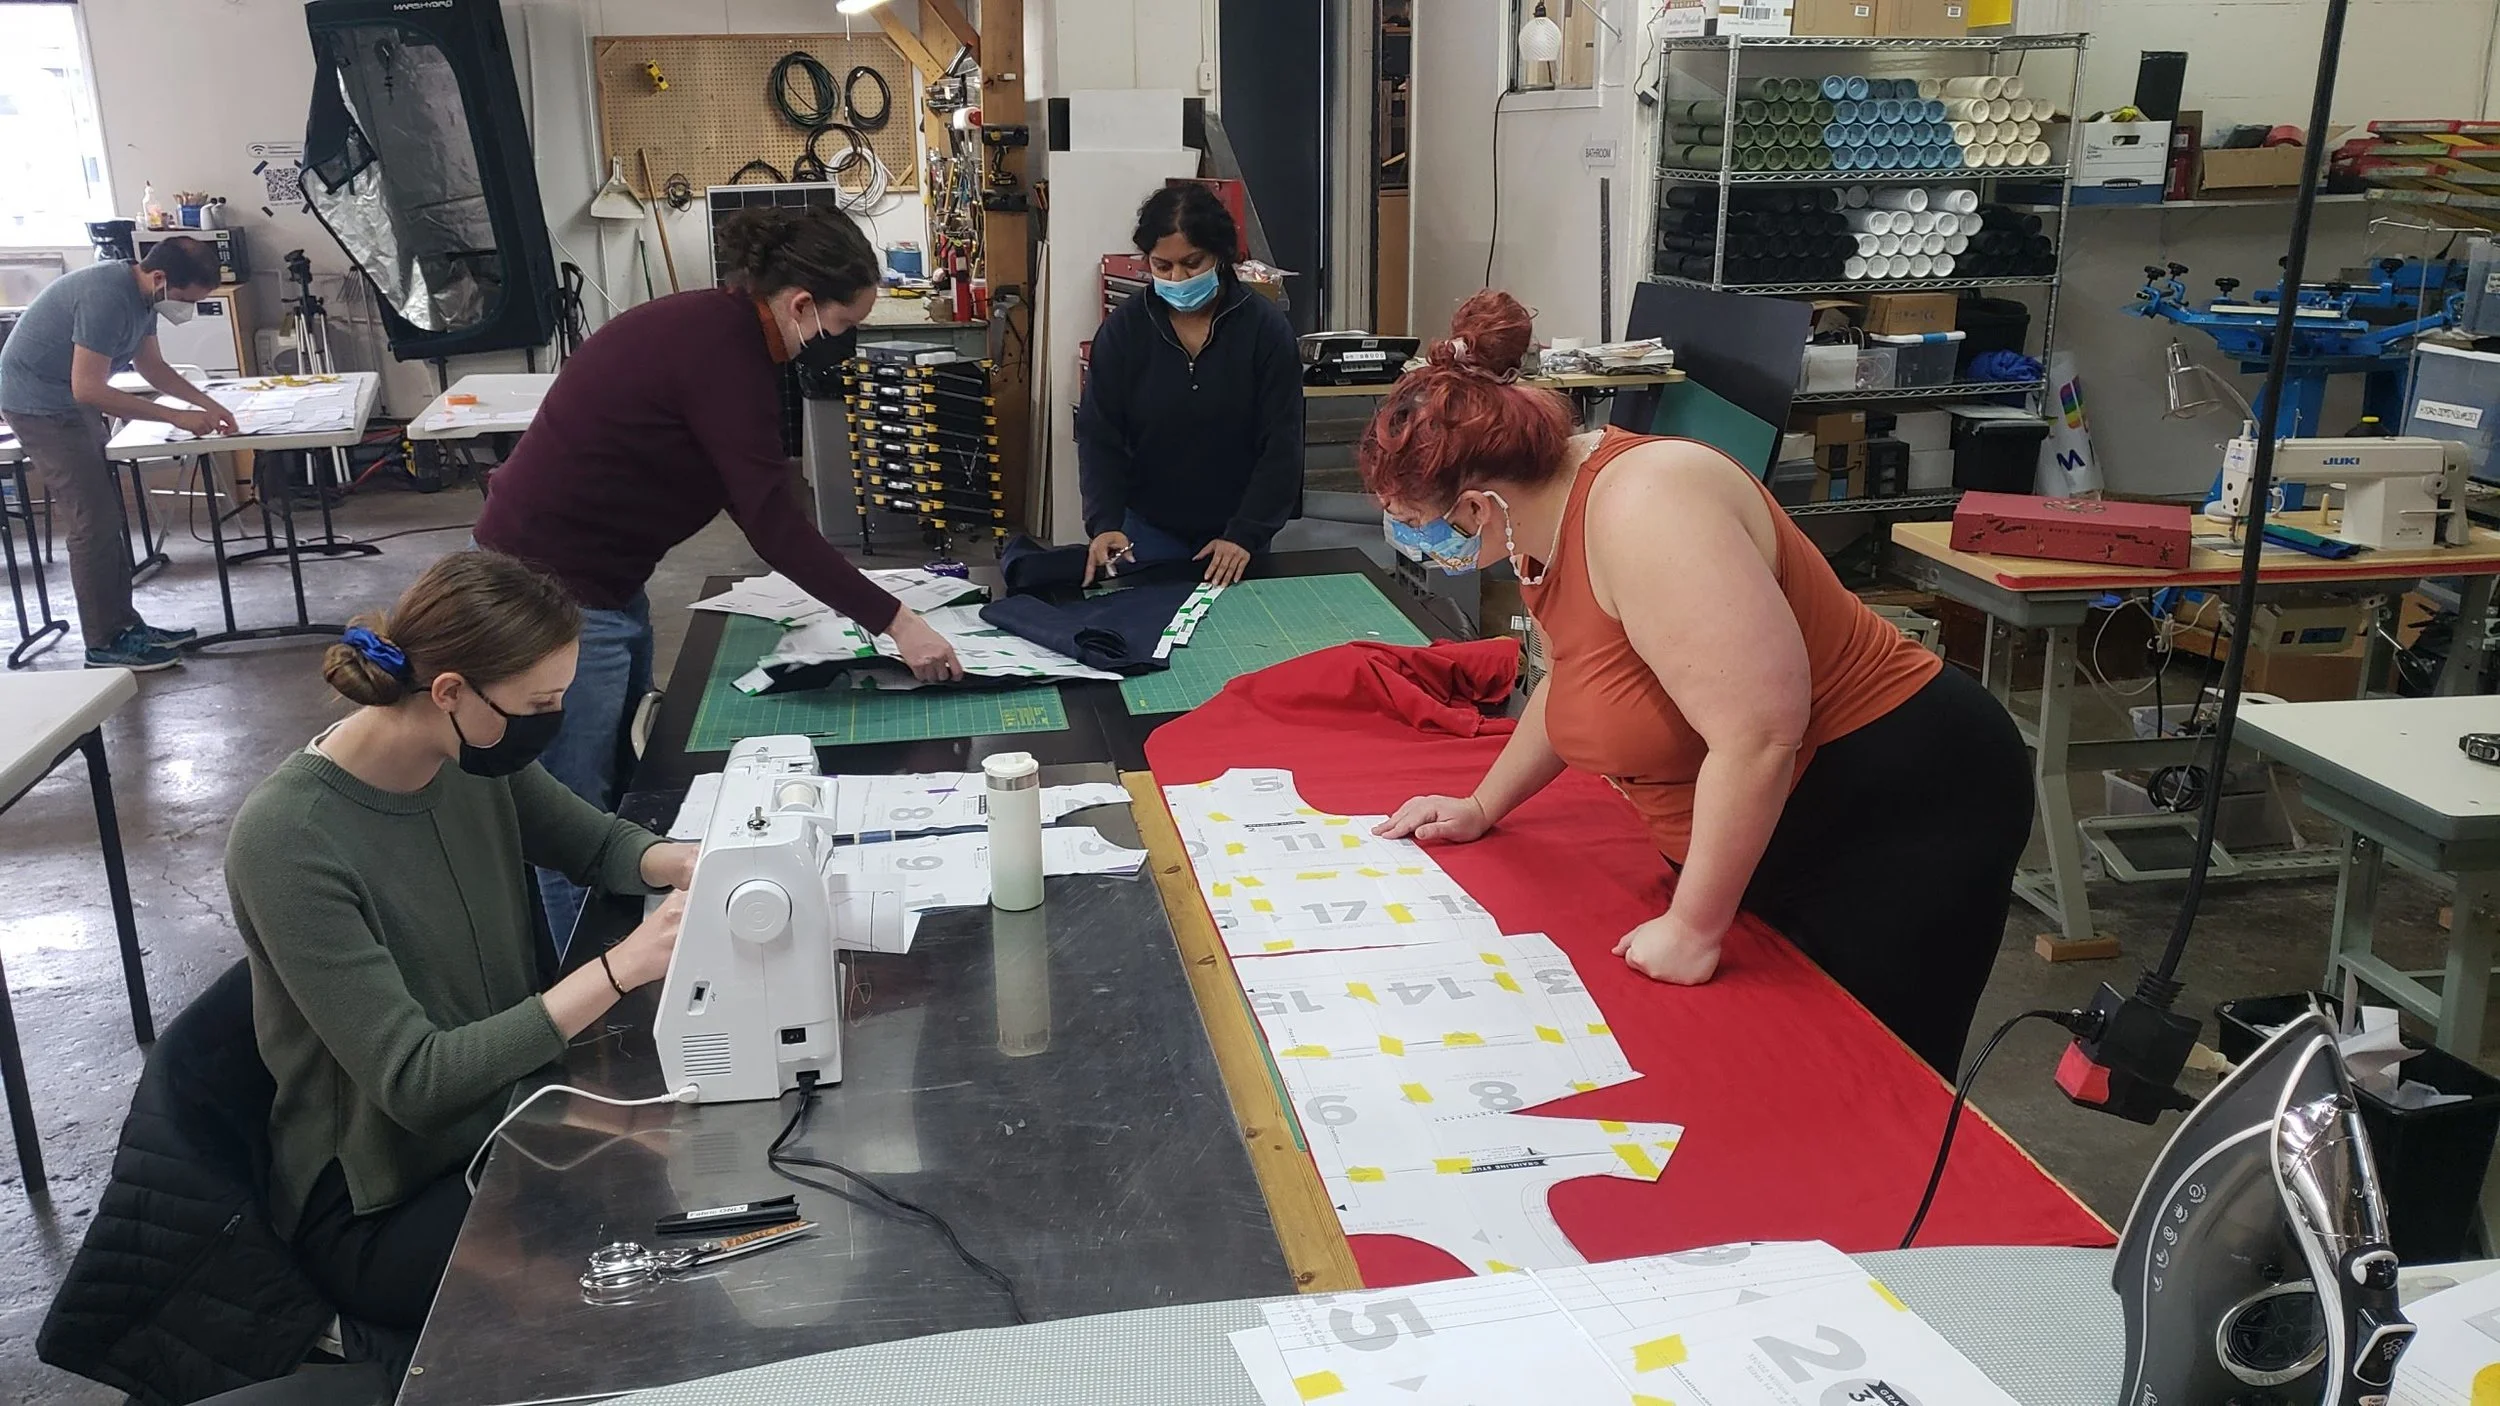
Seattle Makers members work side by side. The makerspace wanted more community building moments like this but didn’t know what direction to take.
Survey Design
The survey was designed to take at most 5 minutes. It featured a question about the responder’s current sense of community (below). The responses were presented on a likert scale from Strongly Disagree to Strongly Agree.
“Please select how much you agree or disagree with the following statement: There is a strong sense of community at Seattle Makers.”
Then there were several questions about possible factors that affect one’s sense of community. For example, whether they read the newsletter or attend meetups. These were largely presented in yes/no format.
“Do you read the Seattle Makers newsletter?”
Keeping the survey at 5 minutes was difficult since there are so many factors that could affect community. I solved this by having a pilot survey run with other volunteers at the makerspace. Based on their response times, I removed several questions that seemed less important or redundant.
Survey Analysis
I had 35 responses to the survey and there are around 160 members of the space. The bulk of the analysis was looking for statistically significant correlations between factors that might affect one’s sense of community and the reported sense of community. On most of these, I used the Fisher Exact Test, given the small amount of data and bounded response types. The full results of the analysis are available on Google Sheets.
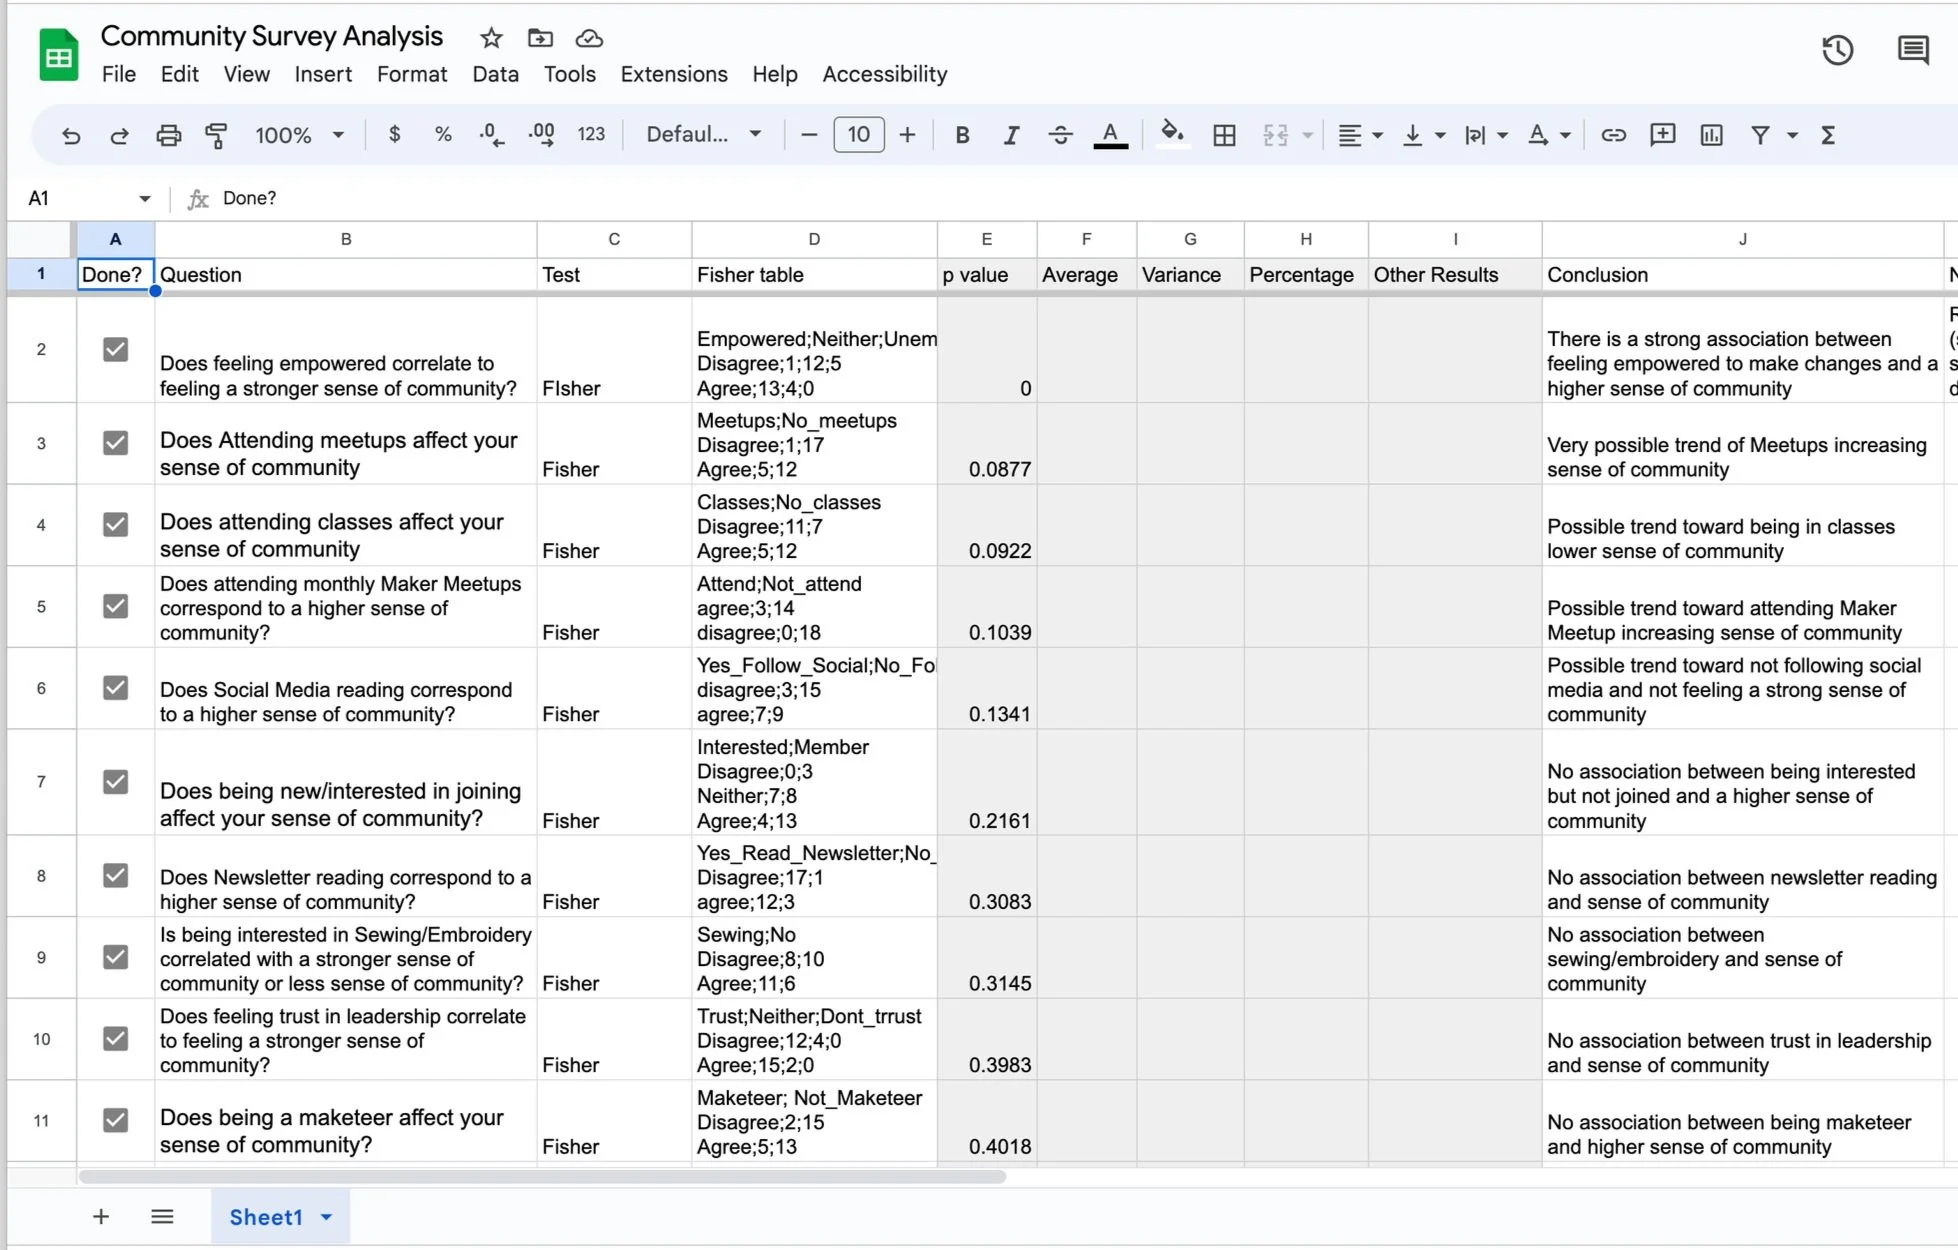
I ran the Fisher Exact test on most of the data to find any correlations. Full results are available on Google Sheets.
I also calculated descriptive statistics to learn useful information like “how many people are new to Seattle when they start at Seattle Makers?” This can help inform decisions like whether to have a New to Seattle Meetup, to help people bond.
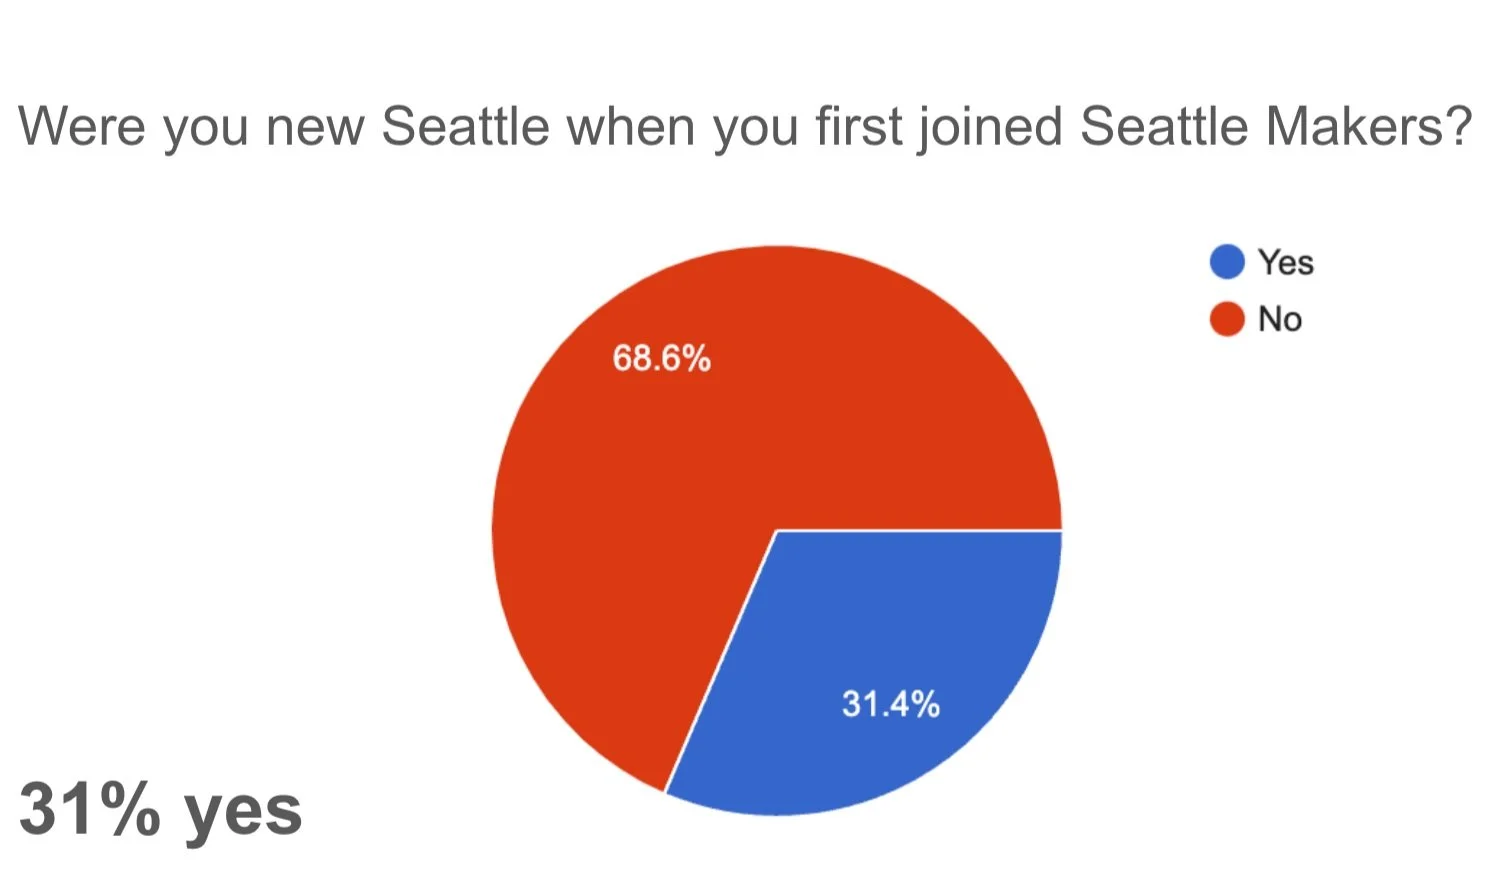
Descriptive statistics like these helped inform direction as well.
Because we were looking to make informed decisions, not necessarily trying to prove a definite correlation, I took any Fisher Test result below p=0.15 to be significant, straying from the academic standard of p=0.05. However, I believe this was still a confidence interval that was reasonable to make decisions off of and ultimately worked better for my stakeholders.
Affinity Diagram
There was a final open-ended question to the survey that asked the following.
“Feel free to give us any other feedback you have, e.g. what are the 3 best things and 3 worst things about Seattle Makers? ”
To analyze this qualitative data, I created an affinity diagram. The full diagram is available on Miro.
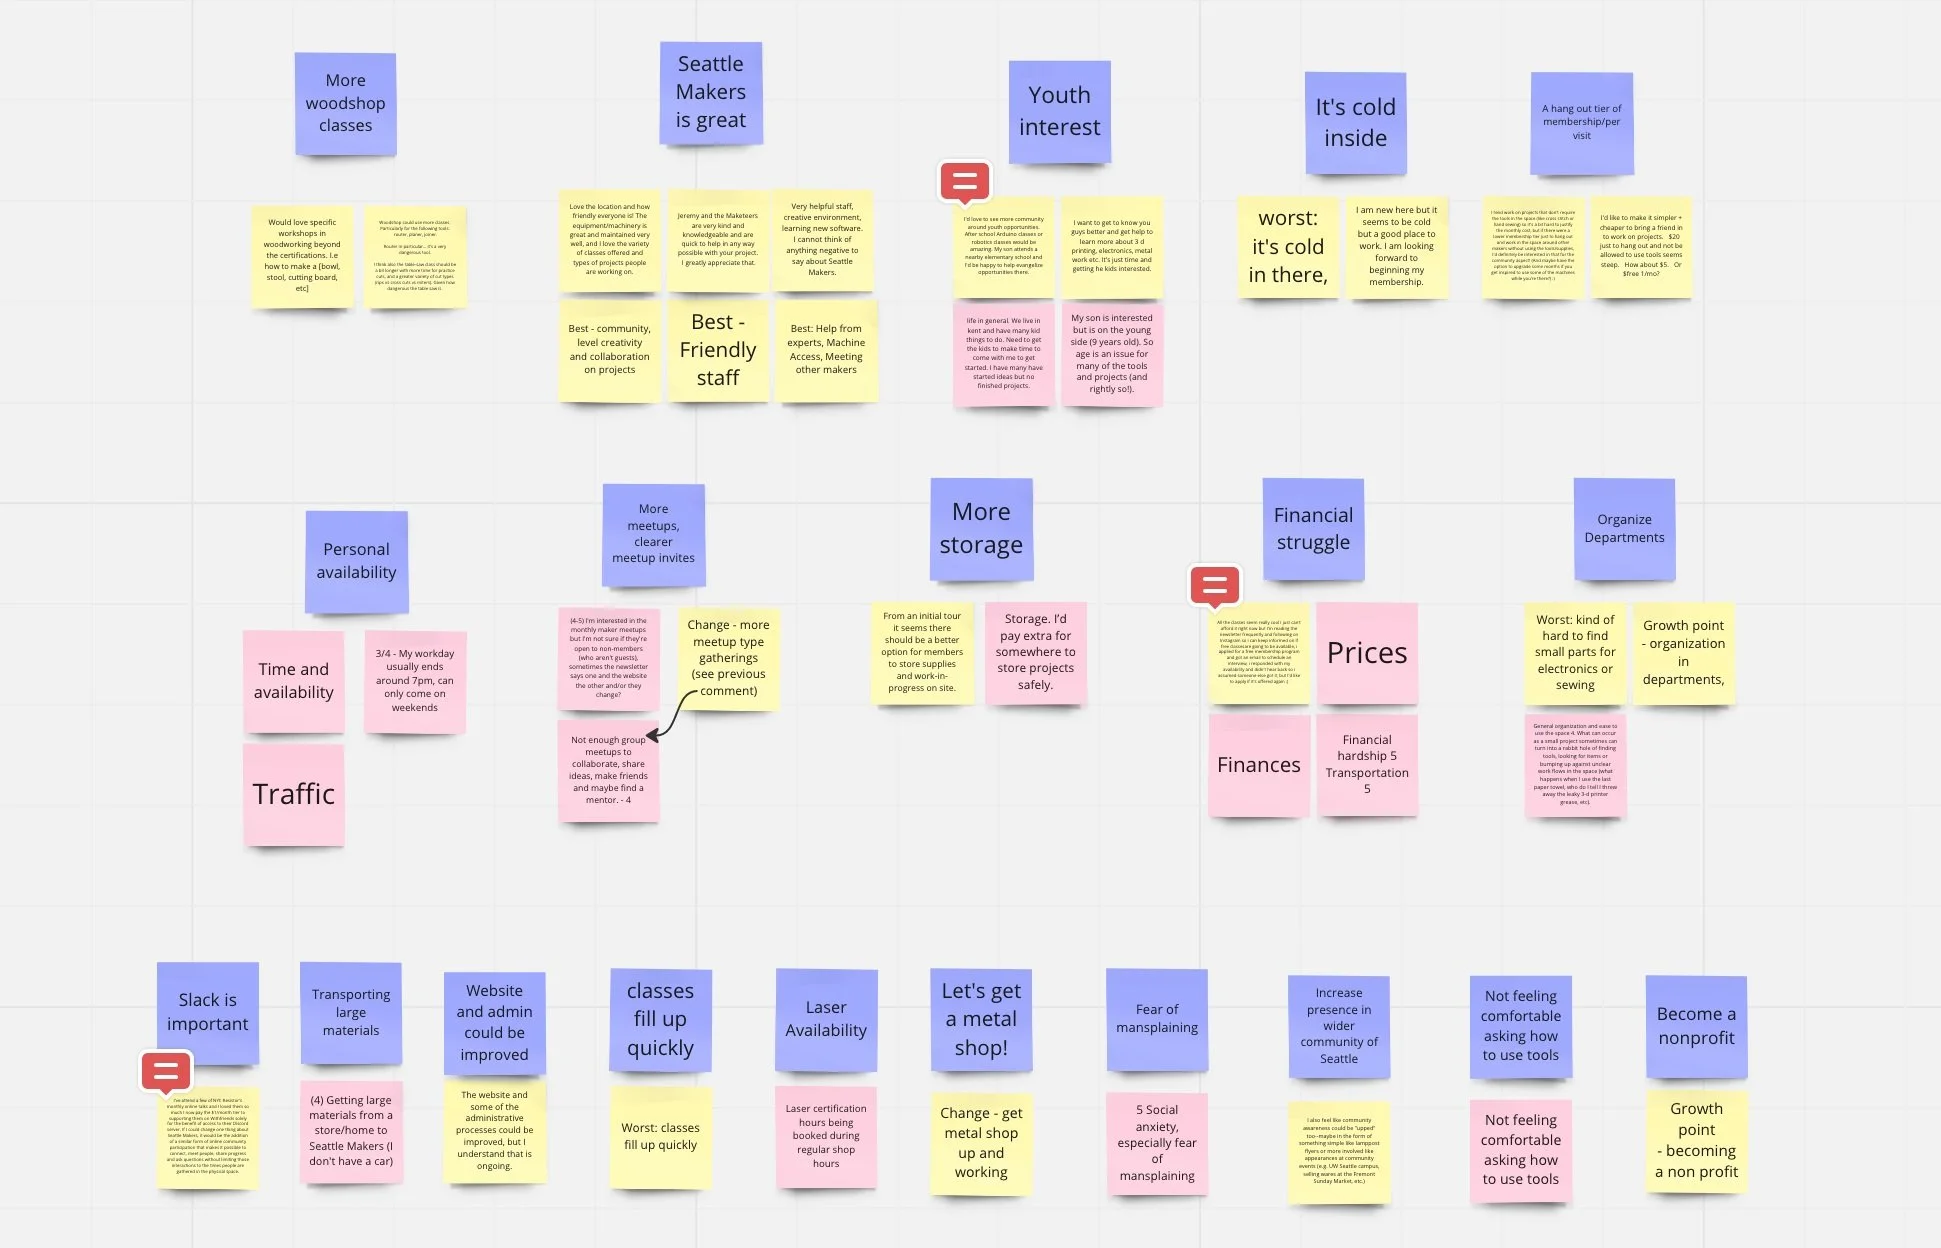
An affinity diagram of the open-ended responses to the survey. View the full diagram in Miro.
Findings
There were four factors that I found to be correlated with sense of community to a significant degree. Below are these findings along with some relevant descriptive statistics.
Empowerment to make changes is correlated with a stronger sense of community.
2. Attending Meetups is correlated with a stronger sense of community.
3. Attending classes is negatively correlated with a stronger sense of community.
4. Following Seattle Makers on social media is correlated with a stronger sense of community.
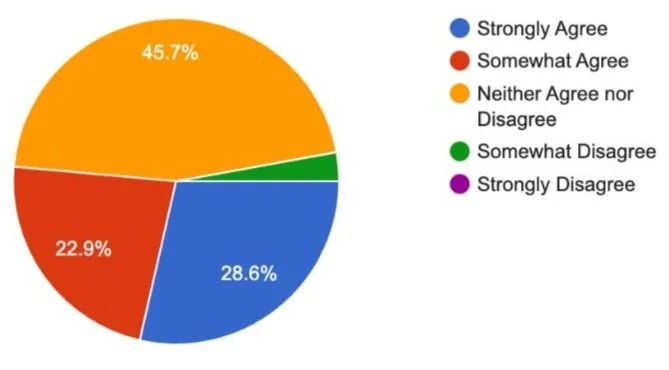
Respondents were asked whether they felt they were empowered to ask for changes at the makerspace. About half agreed.
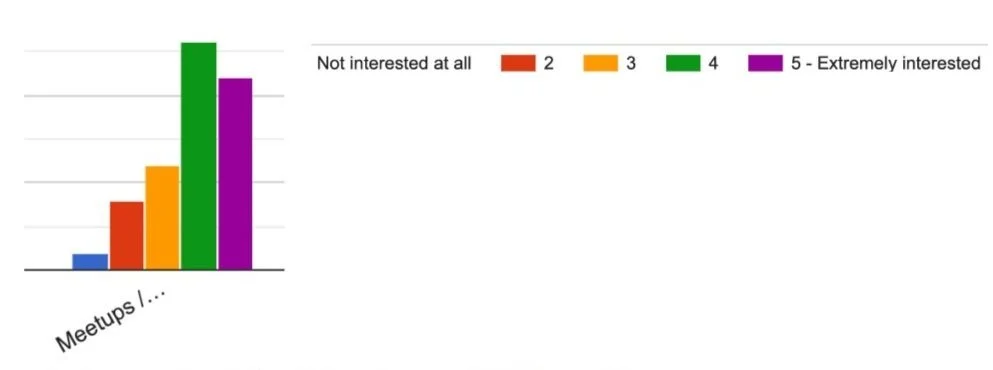
Respondants were asked to rank their interest in meetups from 1 to 5. 69% ranked it a 4 or 5.
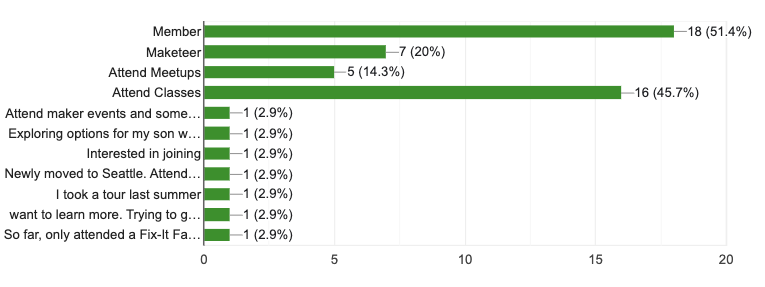
About 46% of respondents attend classes regularly. Almost every member takes a class at some point in order to be allowed to use the machines.
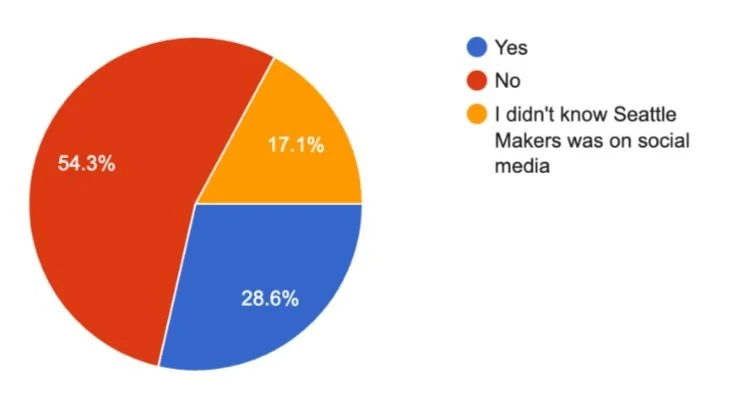
Only 29% of respondents said they follow Seattle Makers on social media, despite it being an important factor for community.
A note about the classes finding: Though there was a negative correlation between attending classes and a strong sense of community, it is important to remember that the tests I ran do not establish causality. It is entirely possible that there is a third variable to blame. However, we can walk away from that finding with an understanding that classes do not add to the sense of community. Since nearly every member takes one, there is possibly a great opportunity to make classes a source of fostering community.
Stakeholder Presentation
I distilled the results into just the most significant and useful results, and presented that to the owner of the space and all the volunteers. Check out the full presentation on Google Slides. I started off with some of the positive feedback we’d received, then moved into what the current sense of community is like, before then explaining the factors that significantly contribute to the sense of community.
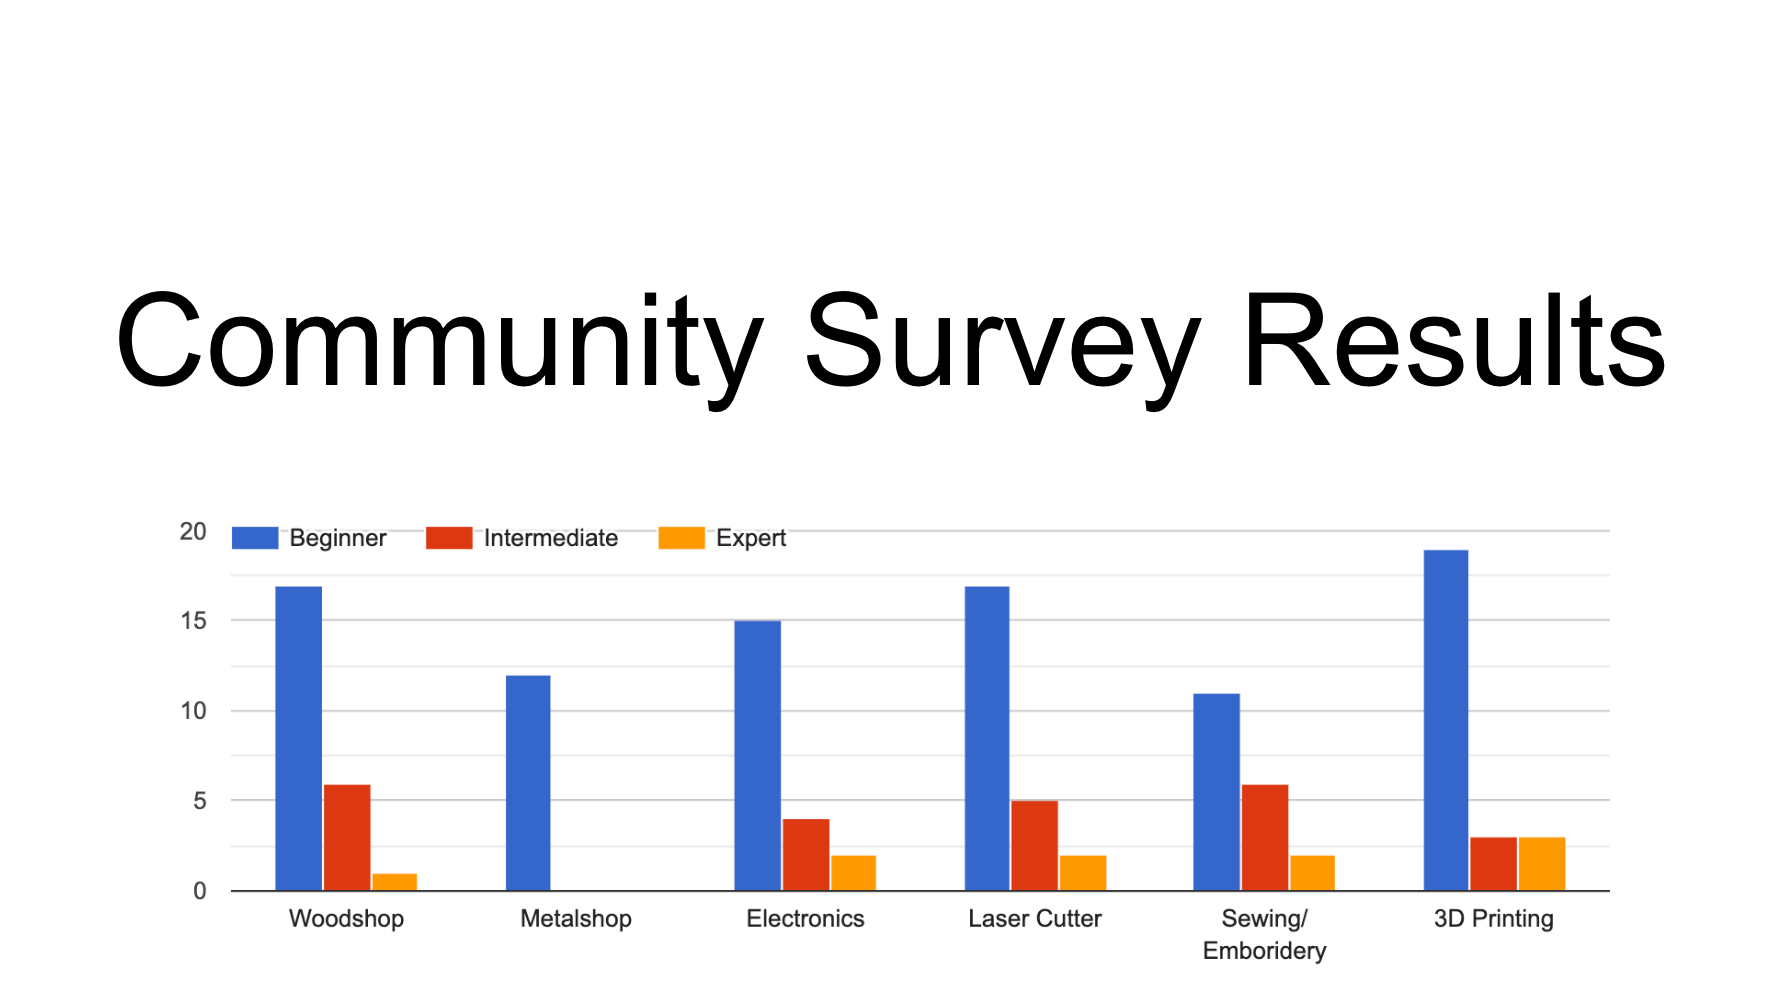
I presented the important findings from the survey to stakeholders. View the full presentation.
Next Steps
Following this survey, I am planning to run contextual interviews with several members of the makerspace. The interviews will focus on more nuanced and complex data that is inherently qualitative and couldn’t be easily answered with a survey.
For example, I plan to ask interviewees what community means to them and what they would like out of the community at Seattle Makers. I’ll also ask questions guided by the findings of the survey such as, “how would you like to be able to ask for changes to the makerspace?” and “what kind of meetups would you like to attend, if any?” View the full interview protocol.
Outcomes
The Seattle Makers staff and volunteers are still in talks about how to act on these findings. They have had several strategy meetings just focused on these results and what type of programming they should introduce based on them.
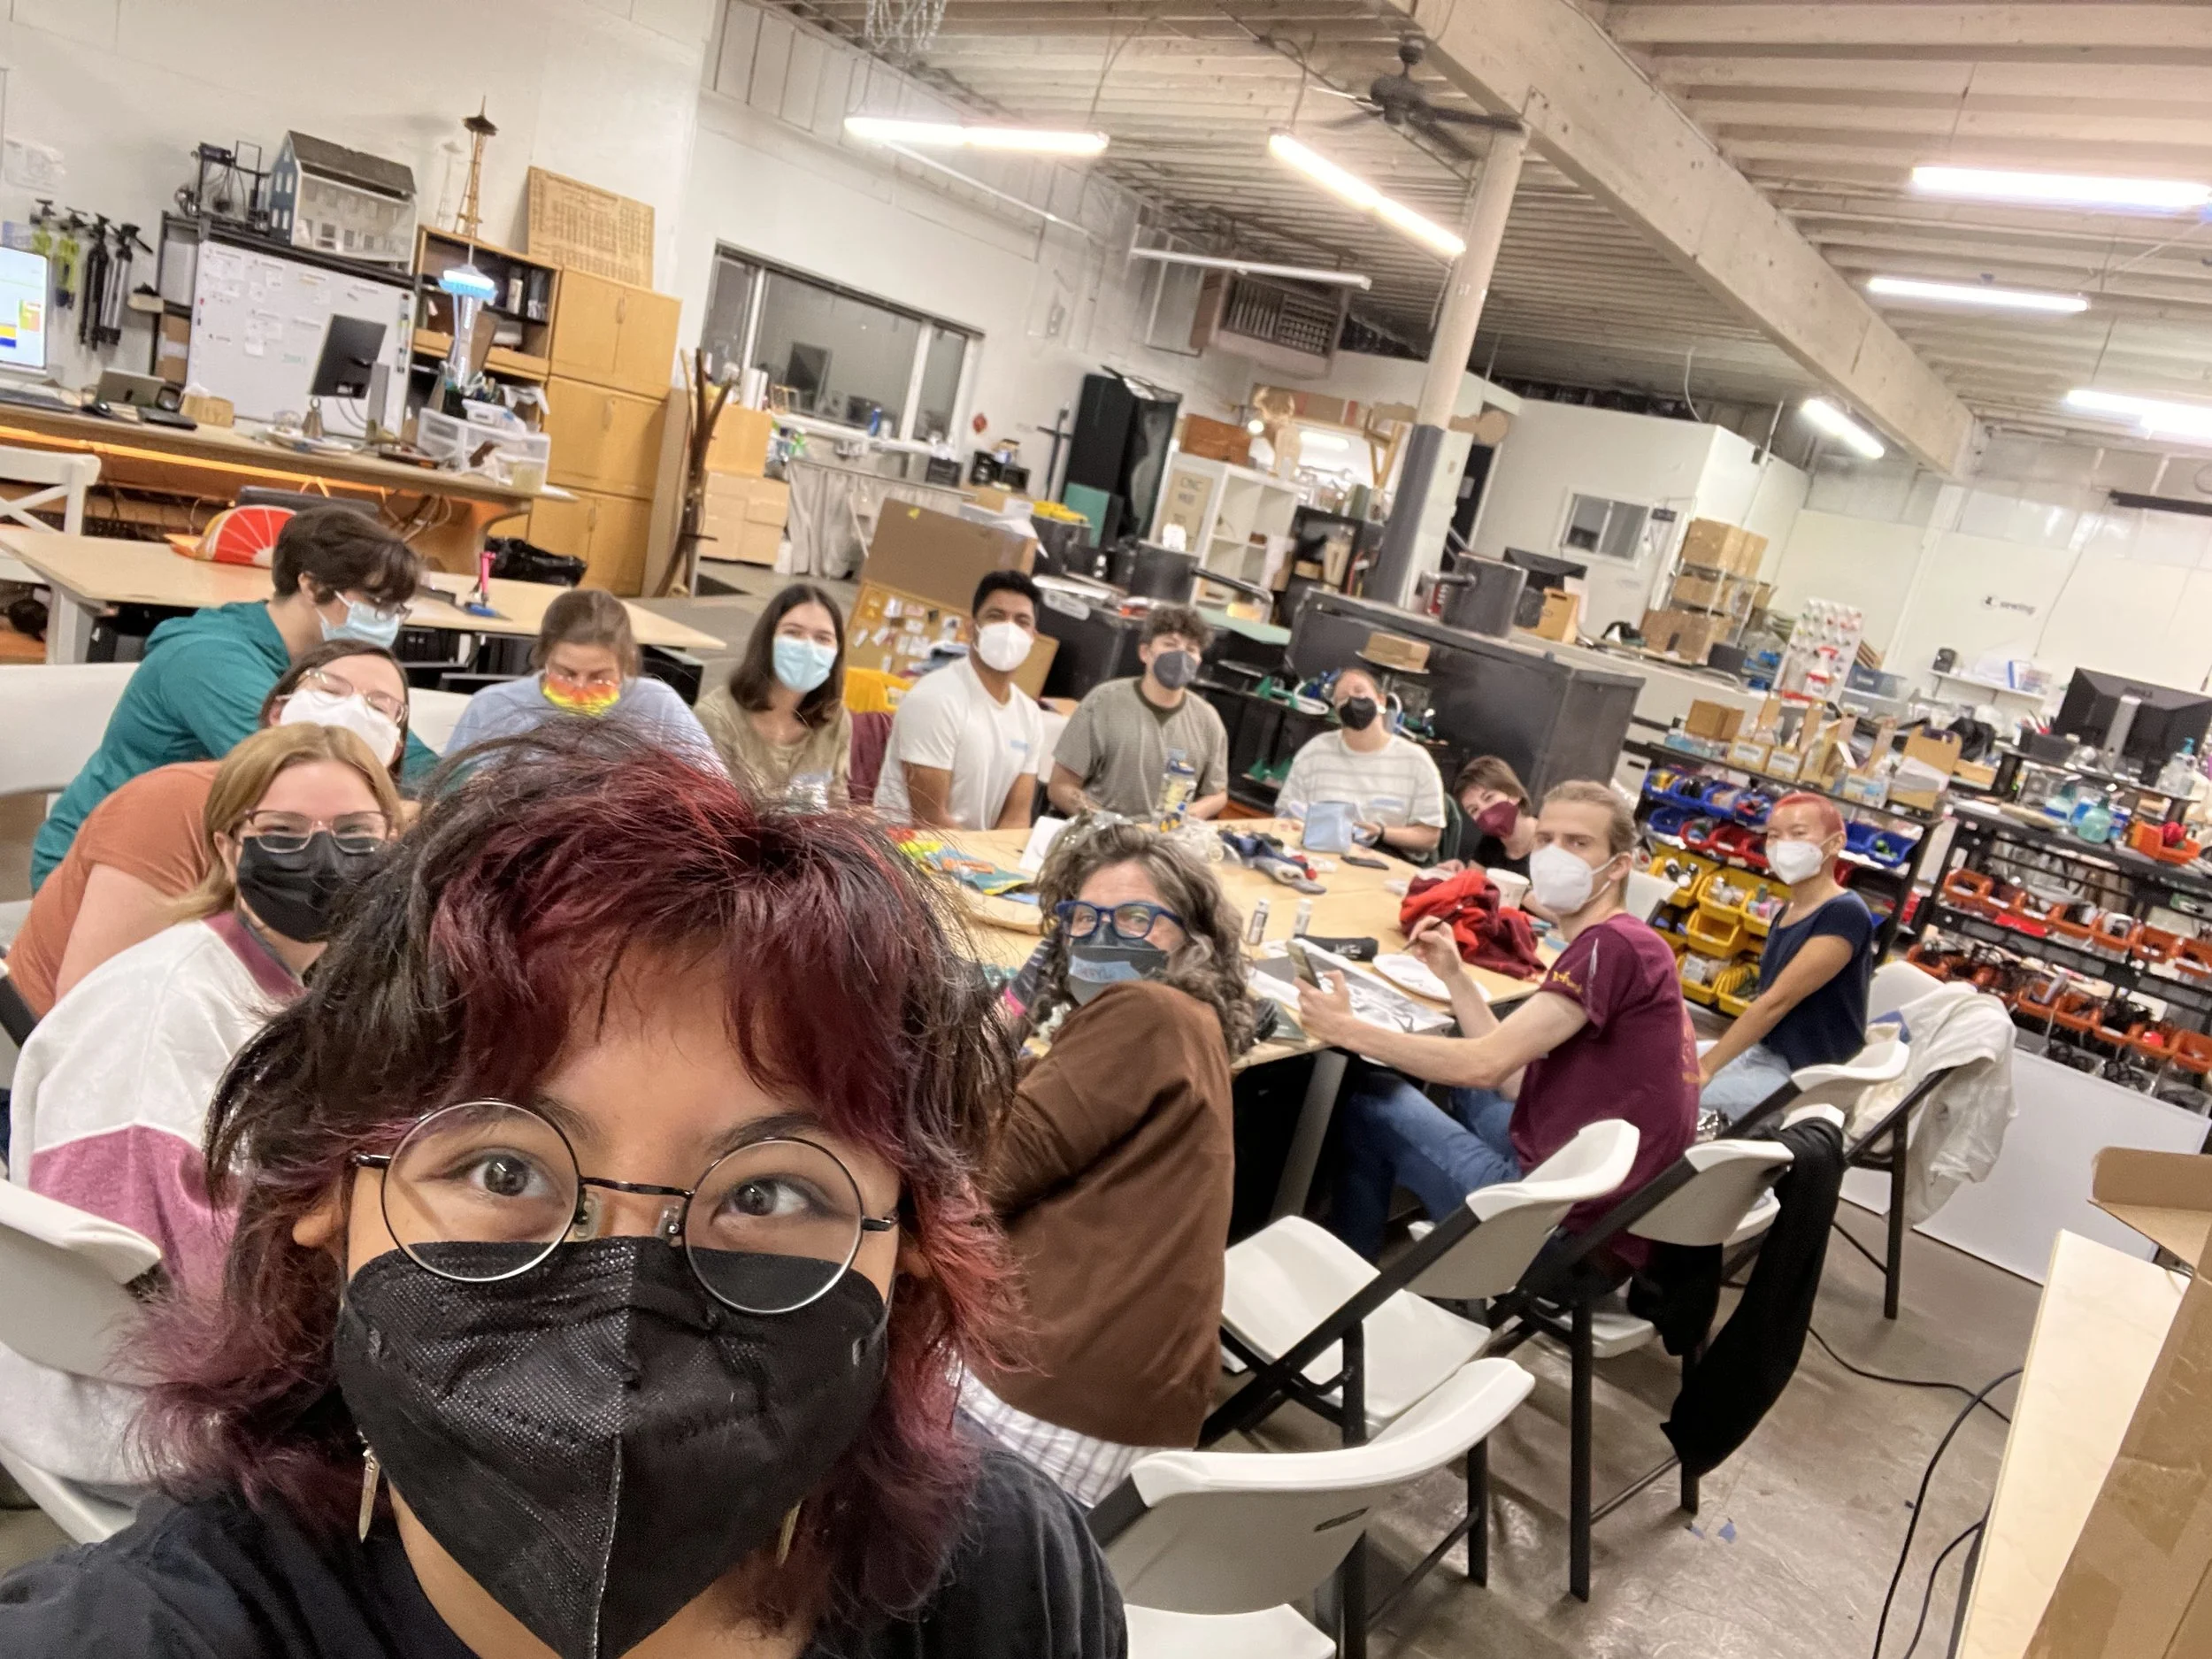
Attendees of a meetup at Seattle Makers. The makerspace is planning more events like these to foster community based on the results of my analysis.